 Station")


Written by Ryan Stiesi
Videography by Walker Perry
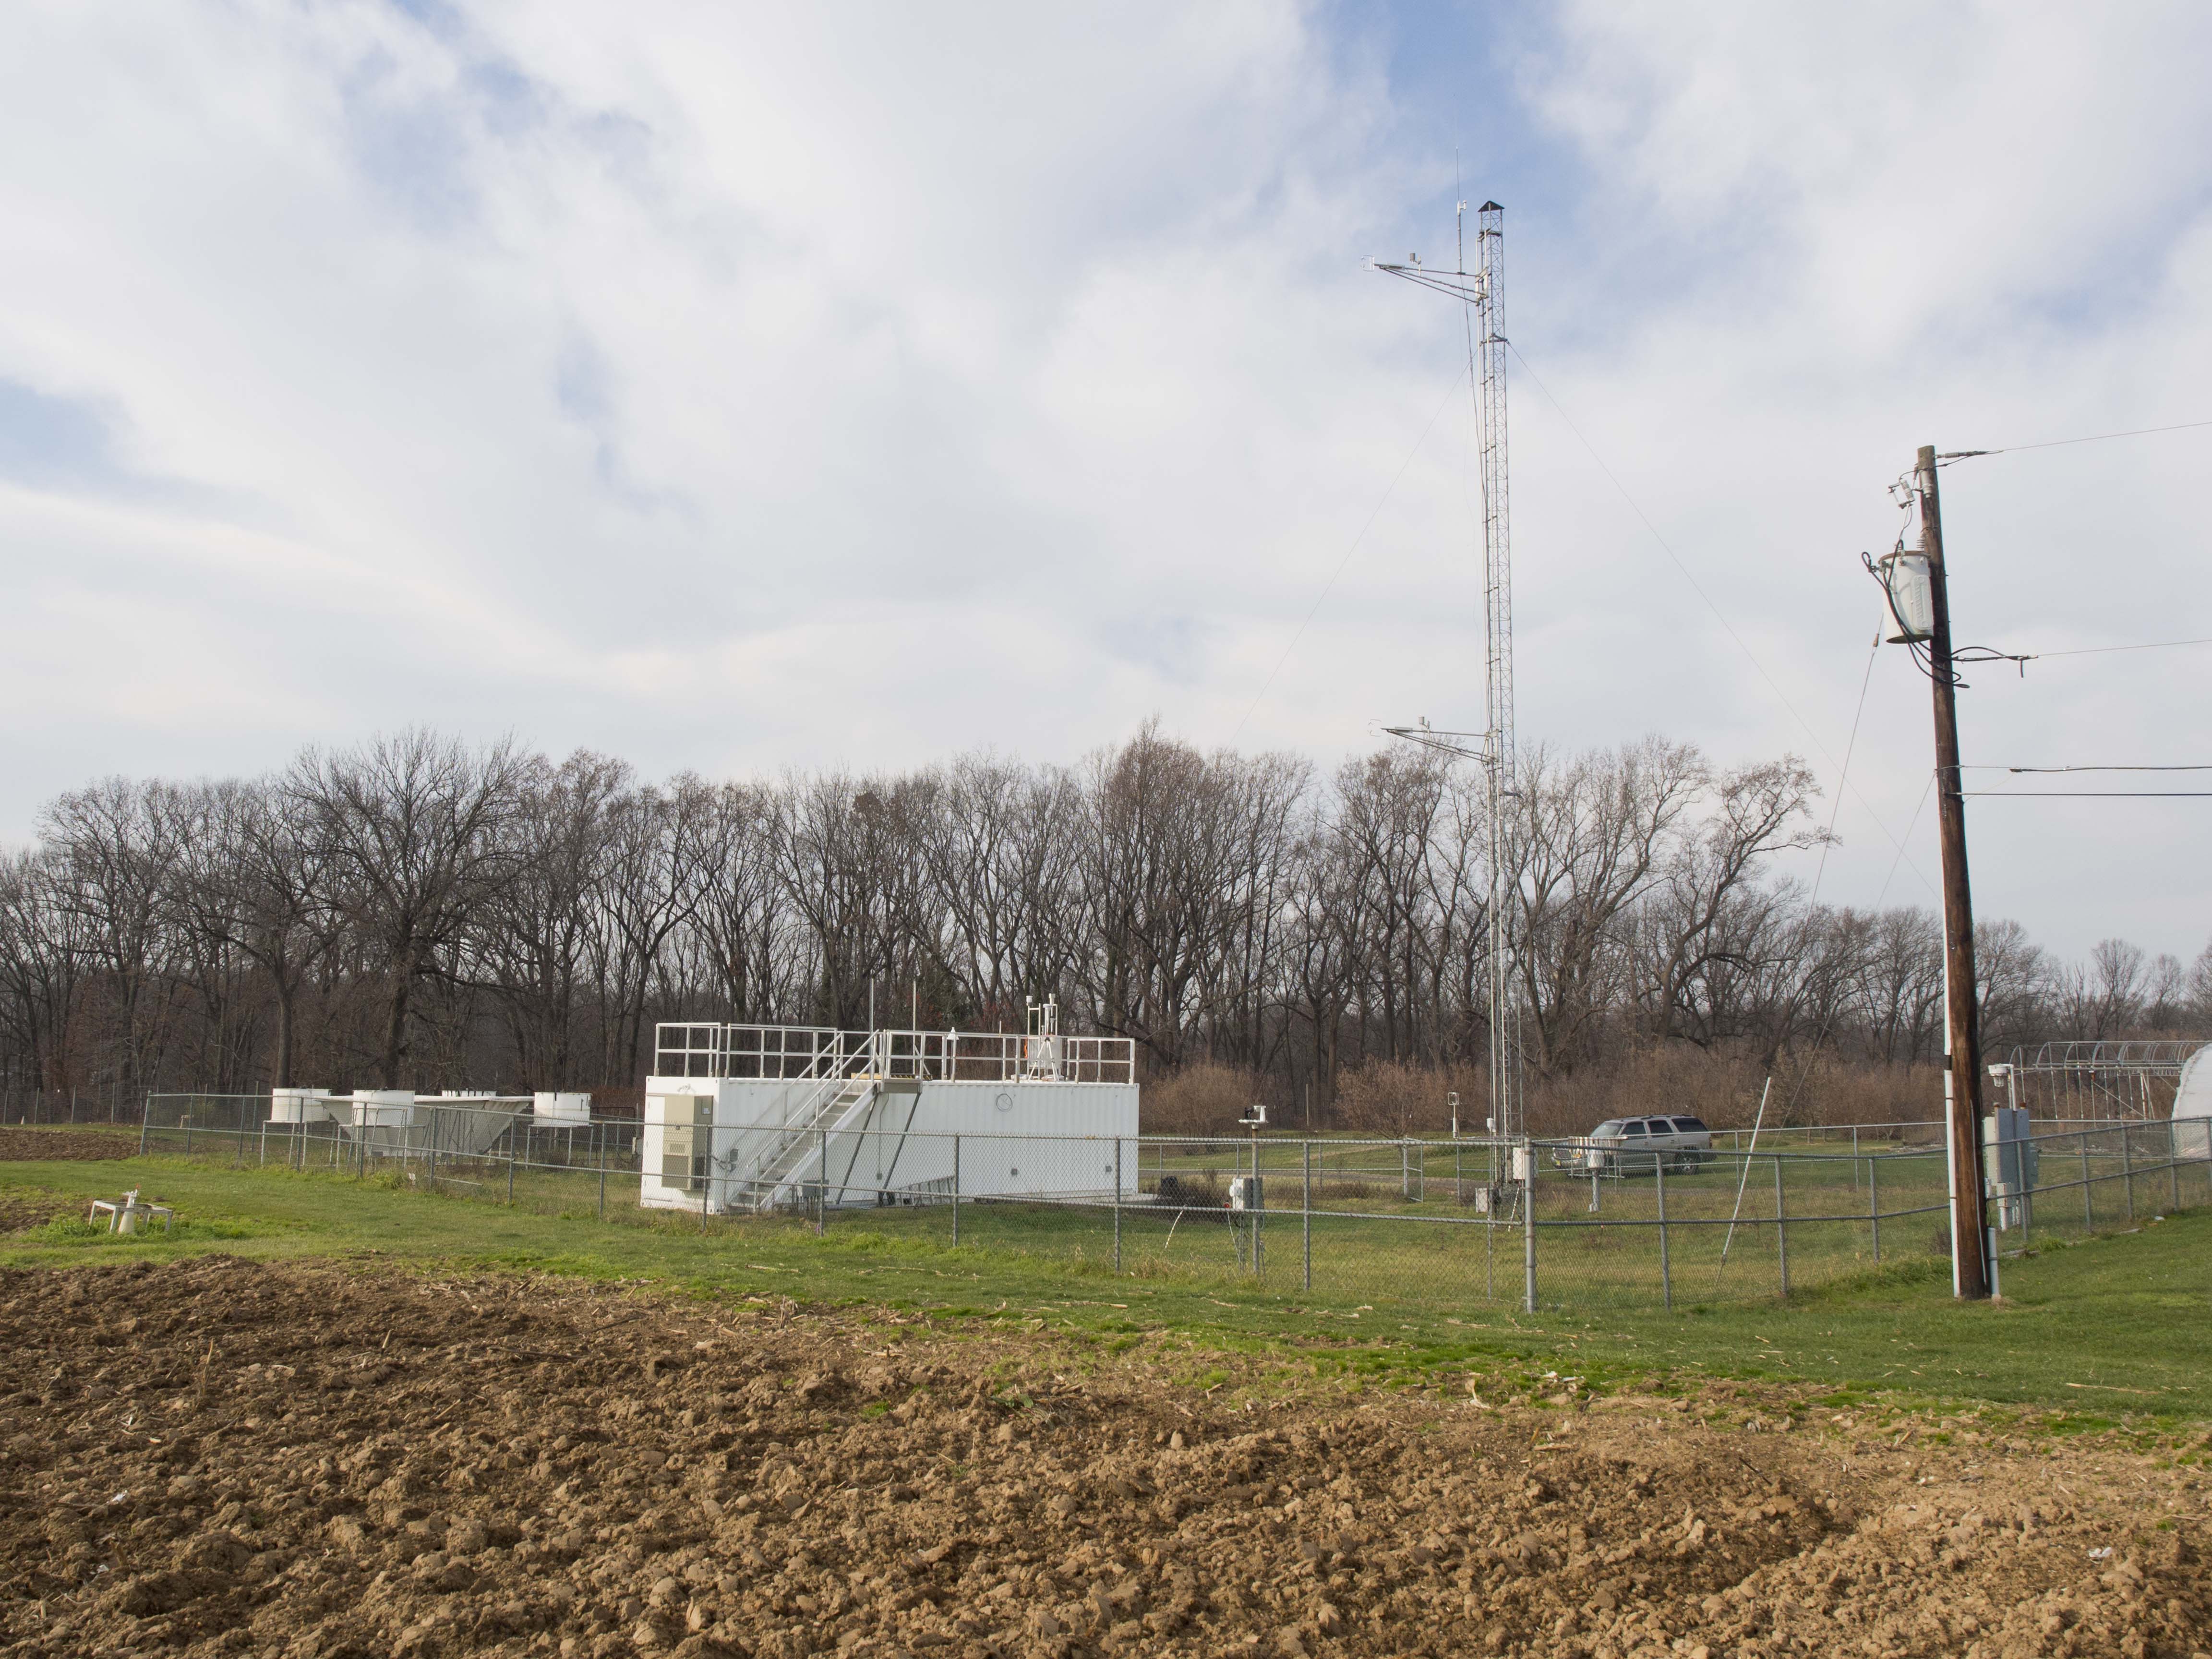
The Pam Site in 2015, shortly after some significant upgrades were made.
The Rutgers PAM Site is now arguably the most sophisticated air quality and atmospheric radiation measurement system in the U.S. Northeast. When Professor of Atmospheric Science Mark Miller took over Rutgers’ Photochemical Assessment Monitoring (PAM) Station in 2011, he was determined to rebuild it into one of the most advanced and effective monitoring sites in the region. Miller, a professor in the Department of Environmental Sciences in the Rutgers University–New Brunswick School of Environmental and Biological Sciences (SEBS), and the former director of the Institute of Earth, Ocean and Atmospheric Sciences (EOAS), said after years of use the equipment had begun to show its age. “The site had reached a point where that degradation had become a limitation,” he said.
Built in 1994 in response to 1993 Congressional regulations arising from the Clean Air Act Amendments of 1990, the Rutgers PAM Site is the first and oldest site of its kind in the U.S. Located on Rutgers Horticulture Research Farm 3, the site measures pollutants and aerosol in the atmosphere and tracks atmospheric conditions like wind and radiation through various instruments. The location was originally chosen by officials from Rutgers, the New Jersey Department of Environmental Protection (NJDEP), Jersey Central Power and Light Company (JCP&L), Public Service Electric and Gas Company (PSE&G) and the federal Environmental Protection Agency (EPA), who collaborated in order to build a measuring station in a centralized spot in New Jersey.
Miller said he had to essentially rebuild the PAM Site. “We replaced everything from the wind sensors that are on the 20-meter tower … we went to a different and new technology there,” he said. “At the time I took over the site there was one radiometer measuring solar radiation, or net radiation, and that radiometer was not functional.” During the last seven years, under Miller’s direction and with the assistance of Matthew Drews, a graduate student pursuing a master’s degree in atmospheric sciences, the PAM Site has grown from outdated to arguably the most sophisticated air monitoring, insolation, and radiation measurement system in the Northeast, Miller said.
The main problems New Jersey faces today when it comes to keeping the air clean, Miller said, are geography and climate. “No matter what you do, the New York City area has a very complicated meteorological profile: there are buildings, there’s terrain, there’s water, there are a lot of factors that govern the flow here,” he said. The state’s nature and coastal location keep its meteorology complicated, but also interesting, Miller said. “Our population is large and dispersed in very complicated ways,” he said. “And so, the types of pollutants that are emitted, the amount of them and their distribution by the local weather is really one of the reasons why New Jersey is a particularly interesting area to look at in terms of pollution episodes and things like that.”
Originally built to provide the data necessary to keep New Jersey in compliance with the Clean Air Act, today the site also serves many additional purposes as well. For example, Miller said, research from the site could be used to optimize solar panels across the country. “When you harvest solar radiation, the nature of the radiation field actually matters,” he said. “That is, if you’re out in the desert southwest where there are basically very few clouds, (and) very little aerosol load, then all the radiation that you receive there is virtually characterized by the direct beam from the solar disk.” He explained that in such a case it would be optimal to orient solar panels toward the sun to harvest the most radiation. On the other hand, in other areas that are cloudier and subject to diffuse radiation, a different orientation might be most effective. “… It might be worth the effort of basically reorienting a few of the solar panels so that, especially in the Northeast summer, when diffuse radiation is prevalent, a certain percentage of your solar panels are dedicated to harvesting diffuse radiation,” he said.
The PAM Site also results in a return on investment for Rutgers students. Miller said that second-year meteorology students take a course called Meteorological Analysis. In it they tour the site to learn about the instruments being used, how they work and the research that is happening in their field of study, he said. Third year students interpret data collected at the PAM site to enhance their understanding of the surface energy budget, Miller said, and seniors and graduate students learn how the wind profiling radar and laser cloud base monitors work.
How the PAM Site works: An EOAS Virtual Tour
The PAM Site is home to various types of equipment that all measure a piece or pieces of the atmosphere, Miller said. Miller said piecing together the evidence and data helps researchers get as close as possible to a complete and holistic view of the atmosphere at a specific location. This is vital because data collected is later used by public and private institutions to understand ozone, carbon dioxide and other emission levels in this densely populated region of the state. It also can tell researchers where pollutants came from, how long they remain in the area and where they will move to next. “There really is no magic instrument that measures everything that we need for most applications,” he said. “In fact, the best way to think about remote sensing and some of the instrument systems that the PAM Site has is by piecing together the state of the atmosphere from the series of measurements.”
20-Meter Tower:
One of the instruments at the PAM Site is a 20-meter tower that measures turbulence in the atmosphere, Miller said. “When pollutants are dispersed in the atmosphere, they’re dispersed by atmospheric turbulence,” he said. “It’s basically the mixing that occurs in the lower part of the atmosphere, that’s what moves things from the surface upward and from upward down.” Miller said to quantify turbulence the tower has three measurement points — at 2, 10 and 20 meters — that record wind, temperature and humidity at each height. He said for measuring the wind specifically, it uses sound to measure small fluctuations in the wind at approximately 30 times per second.
Wind Profiler:
This instrument measures wind profile, which is the change in speed and direction of the wind with height, up to approximately 5 kilometers, Miller said. In the center, square area is a vertically pointing doppler radar, Miller said. The radar has three beams — One pointing directly up, one 15 degrees off zenith to the east and a third to the north. “What this radar measures, what its target is, basically, are turbulent eddies in the atmosphere,” he said. “So as turbulence moves by, this radar basically measures those turbulent eddies, it measures basically the electromagnetic scattering by those eddies and it measures their velocity … We can actually compute the horizontal speed and direction of the wind, using those turbulent eddies.”
Miller said that in the four cylinders surrounding the radar are speakers that propagate sound upward once every hour for a few minutes at a time. “And we actually, with this radar, measure the speed of those sound waves as they move up in the atmosphere,” he said. “Well it turns out that the speed of sound is proportional to temperature.” Miller said this allows research to also measure the virtual temperature of the atmosphere.
Atmospheric Radiation Tool (Solar Tracker System):
This instrument measures the radiation budget: radiation incoming from the sun and outgoing from the Earth, Miller said. “Now sometimes when you hear the word radiation you tend to think of ‘oh my goodness, an alarming thing,’ well this happens to be solar radiation, sunshine, and it also is a measurement of terrestrial radiation — that is radiation that the Earth basically emits into space,” he said. The tool also separates solar radiation into direct radiation, which comes directly from the sun’s disk and is more common on a clear day, and diffuse radiation, which is more common on cloudy days, Miller said. Miller said that cloud coverage alters the radiation field. “Things like collecting radiation with solar panels depends highly on the nature of the radiation field, so that’s one application,” he said. This also affects instruments like weather models, he said.
Multi-Filter Rotating Shadowband Radiometer:
Similar to the previous tool, this instrument also measures solar radiation, Miller said. A band on the instrument rotates and stops just so that it shadows the sun and measures the diffuse radiation, Miller said, before moving down to measure total radiation. “And by subtracting total and diffuse, we get direct,” he said.
Miller said it differs because it records bits of radiation into discrete wavelengths as part of a spectrum measurement. Researchers can divide radiation into narrow bands and tell how specific wavelengths of aerosol affect the radiation, Miller said. “We’re able to actually compute the effect of aerosols in each of these little wavelength bands, and by doing that we’re able to understand what aerosol is up there and how much of it,” he said.
Ultraviolet Radiation Instrument:
“So, this radiometer measures the ultraviolet spectrum, and it’s that part of the spectrum that produces sunburn,” he said. Miller said this includes UVA and UVB radiation, which sunscreen and other products try to protect people against.
Laser Ceilometer:
This instrument consists of a large case that holds a laser and sends a 15–meter pulse upward rapidly, Miller said. The laser is not visible to the naked eye, he said. Each pulse gathers returns from aerosol or other pollutants in the sky, Miller said, but it also can tell researchers where the cloud base height, or lowest altitude of the visible part of a cloud, is. “This pulse will send back an echo right until it enters the cloud and the echo stops, because as soon as the visible light enters the cloud, it’s dispersed,” he said.