

By Craig Winston and Matthew Drews
Opening Up States Will Reignite Air Pollution
The skyline is more visible. The air looks and smells cleaner. There are “before” and “after” pictures of heavily polluted cities like New Delhi and São Paulo’s on the internet. Is the reduction in traffic and industry brought about by the COVID-19 lockdown responsible for these otherworldly changes?
In the northeastern United States, for example, measurements NASA recorded along the I-95 corridor, from Washington D.C. to Boston, indicated that levels of a major polluting factor, nitrogen dioxide, were 30 percent lower in March 2020 than the mean for the same month 2015-2019. Nitrogen dioxide comes primarily from vehicle emissions, power plants, and diesel-powered equipment, and reacts with other chemicals in the air to form particulate matter and ozone.
But not every locality, or pollutant, reflect the same improvements. In Hawaii, at the Mauna Loa Observatory sampling station where global atmospheric carbon dioxide concentrations are measured, there has been no sign yet of “missing” emissions due to COVID-19, according to the NOAA. While there may be a marked decline in the coming months, its effects on our climate long term will be negligible, according to Robert Kopp, director of the Rutgers Institute of Earth, Ocean, and Atmospheric Sciences and a professor in the Department of Earth and Planetary Sciences. He explained that what matters is not the emissions from a single year but the total of all emissions emitted across the years.

“With the global economic downturn, we may be looking at the most abrupt decline in carbon dioxide emissions in history this year, but this decline is almost immaterial. The climate doesn’t care about emissions in one year. It cares about the sum total of all emissions emitted across the years, so what matters for climate change is what happens next. As we rebuild our economy, are we going to invest in a green stimulus that places the United States and the world on a path toward net-zero carbon emissions and a stable climate, or are we going to try to bail out the fossil fuel industry and put all the pieces back to where they were last year? From a climate change perspective, that’s the real question.”, Kopp explained.
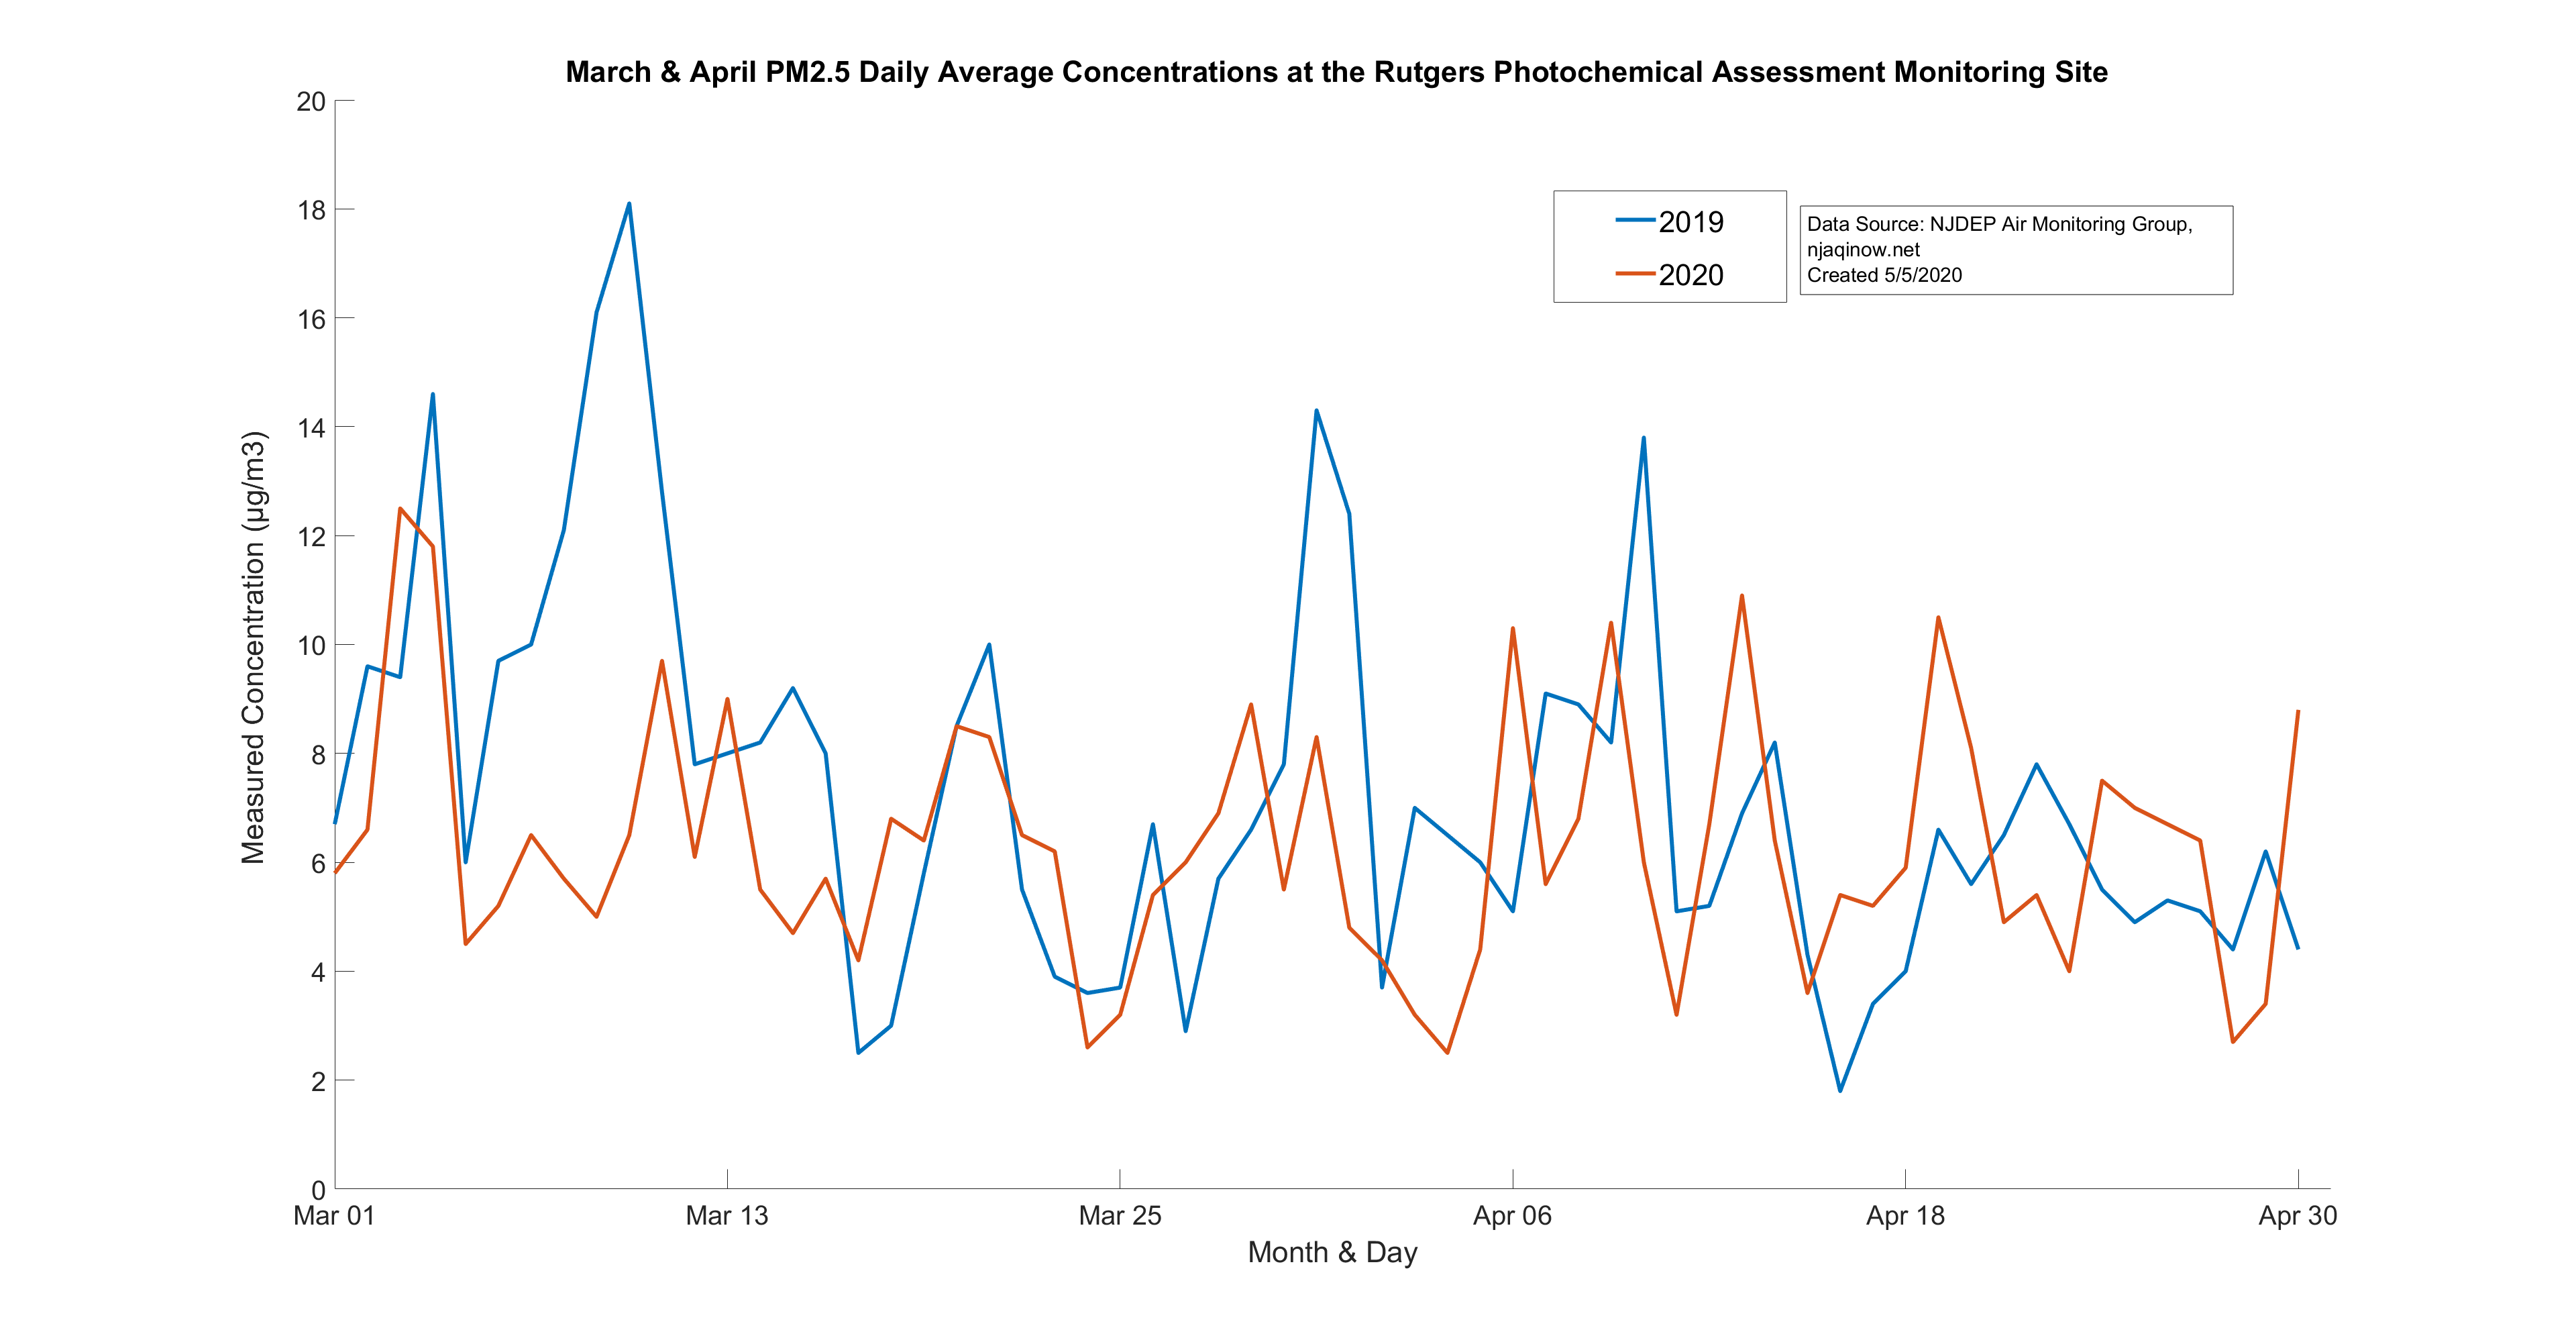
In New Jersey, recent air quality has been popularly described as better than in the past. But, as the averaged state readings only came from about 12 stations, the results are not thorough enough to establish a solid change statewide. In the New Brunswick area, for example, there is no verifiable evidence that levels of toxic particulate matter (PM2.5) have dropped precipitously as a result of the shutdown. While New Brunswick usually rates as either “good” (less than 12 micrograms per cubic meter) or “moderate” (12.1-35.4 micrograms per cubic meter) in average PM2.5 concentration, there has been no significant improvement since the shutdown based on ground measurements. These particulates are equal to or smaller than 2.5 micrometers in diameter (about 3 percent of the diameter of a human hair). The primary sources of PM2.5 in the atmosphere include incomplete combustion, automobile emissions, dust, and cooking.
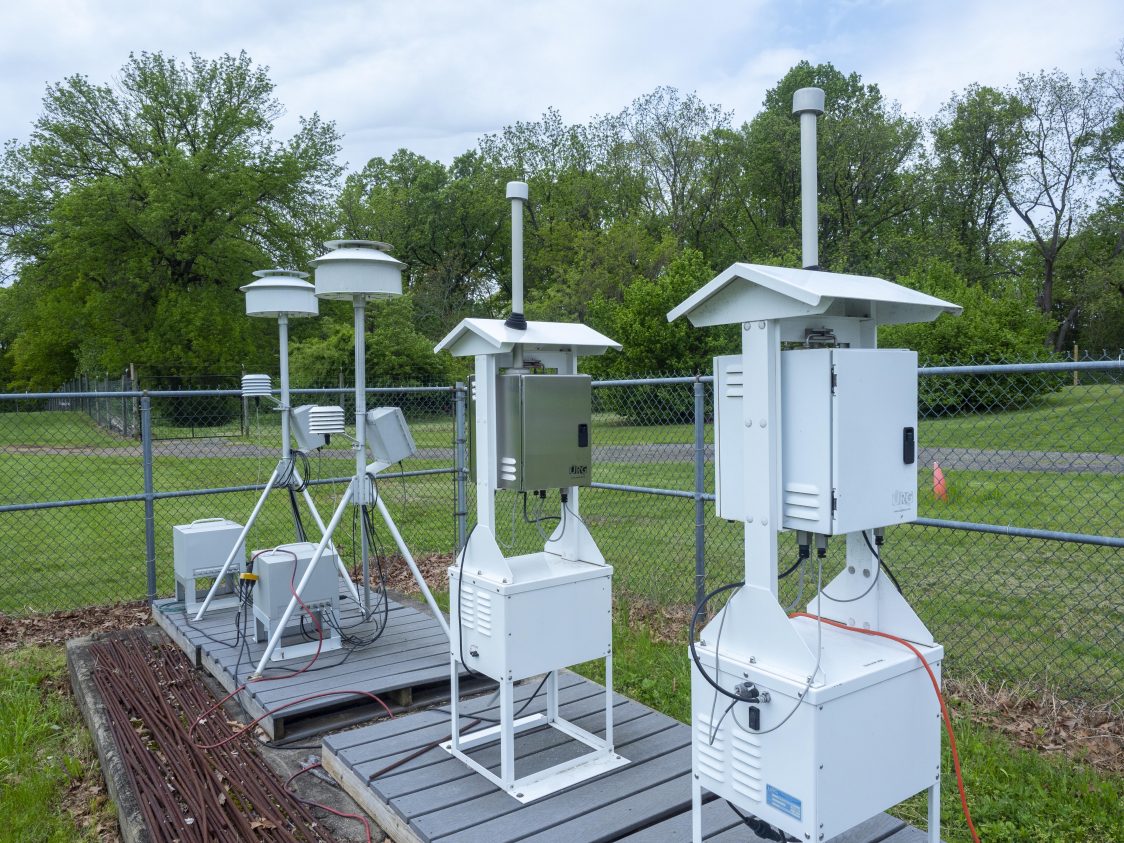
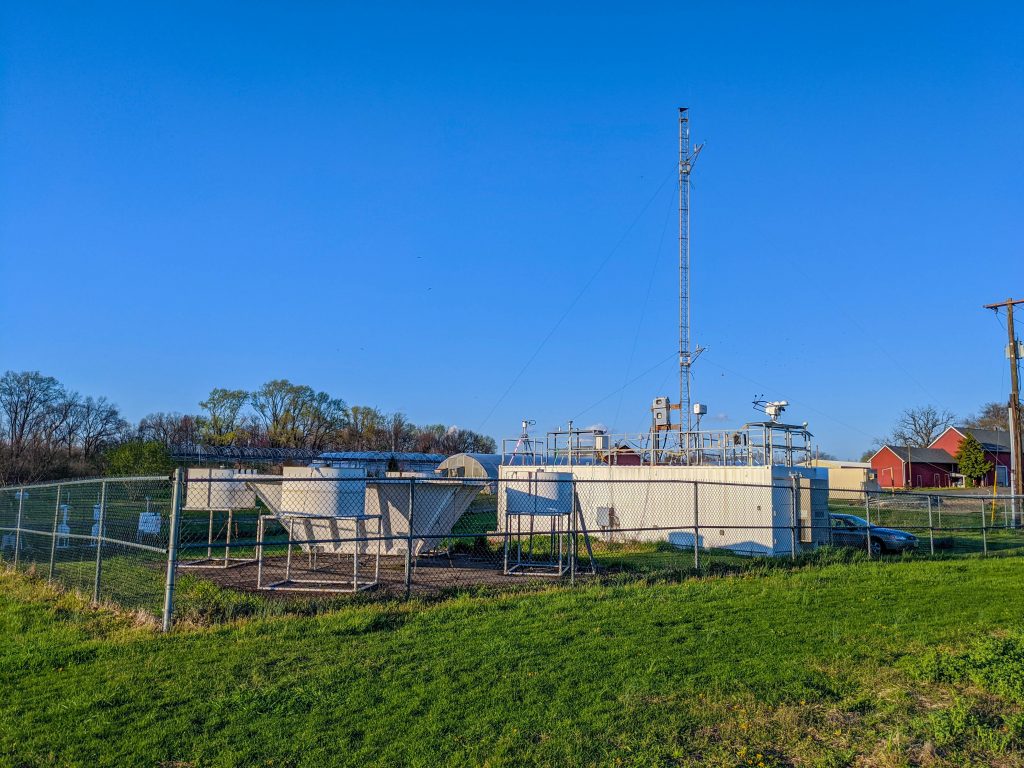
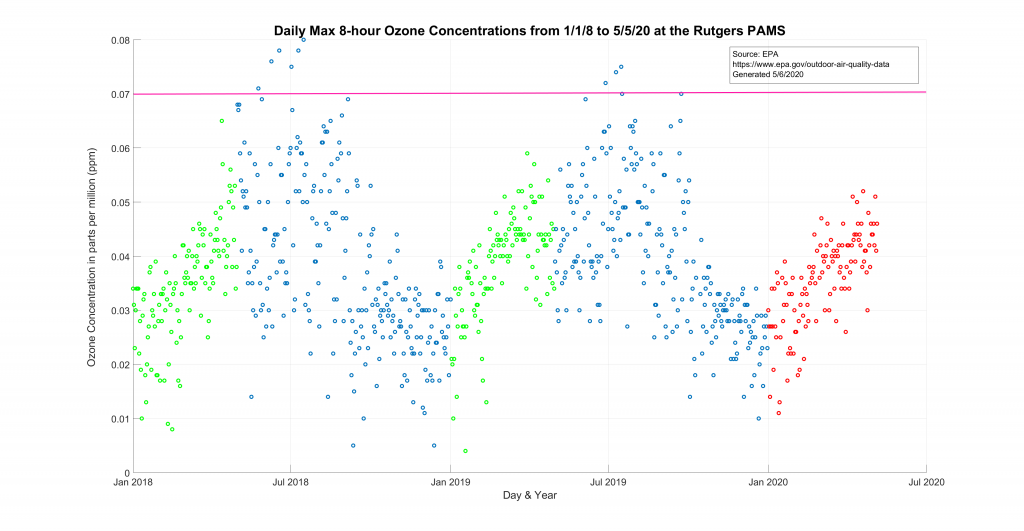
While the city’s ozone concentrations have mostly remained within the EPA’s “good” threshold throughout the shutdown, that is not unusual for this time of year. It is too early to say whether New Jersey’s ozone levels will be significantly impacted by the COVID-19 shutdown. Ozone is a secondary pollutant in the lower atmosphere formed when other pollutants that are directly emitted react with sunlight to form ozone. The amount of sunlight needed to generate unhealthy levels of ozone usually only occurs during the summer months in New Jersey. The EPA considers Middlesex County a “non-attainment” area in that it fails to meet National Ambient Air Quality Standards (NAAQS) of 70 parts per billion (0.07 parts per million) averaged over an eight-hour period, with the highest readings typically in July and August. The readings for the New Brunswick area come from the Rutgers Photochemical Assessment Monitoring Station (PAMS), a joint venture between the New Jersey Department of Environmental Protection and RU, located on Ryders Lane in East Brunswick, about two miles west of I-95. A permanent air monitoring facility in operation since 1994, the site was chosen due to its centralized location within the state, as well as that samples from the late 1980’s from this part of the state were found to have some of the highest concentrations of ozone in New Jersey.
Pollution’s Insidious Effect on COVID-19
A nationwide study released last month by Harvard researchers connects high levels of air pollution to higher rates of death from COVID-19. Monica Mazurek, associate professor of civil and environmental engineering at the RU School of Engineering, realizes that the air pollution will soon return (“like turning on a switch”) when vehicles hit the road and industries begin ramping up.
Scientists have a high degree of confidence that long-term exposure to the tiny particles can do great damage. The Harvard study found that only a small increase in long-term exposure to PM–one microgram per cubic meter—could lead to a 15-percent increase in the COVID-19 death rate. Those with heart or lung disease, children, older adults and people of lower socioeconomic status are most at risk from PM exposure.
“Whenever you burn [carbonaceous fuels], you actually get nano particles and they start to coagulate and form micron size particles,” said Mazurek. “Typically, if we look at the distribution of the size of the aerosol, it’s about one to two micron diameters. This is small enough for us to breathe and go deep into the lung tissue. It stays there. It can permeate the lung tissue barrier and actually partition into the bloodstream.”
Mazurek said the Harvard study reveals “the missing link between why so many people in urban areas fall victim to COVID-19 and get very sick and some unfortunately die. It’s just the chronic exposure to fine PM, particularly carbonaceous fine PM, that’s the problem exacerbating the COVID-19 outbreak.” The American Lung Association relates at least one bad rating of the six indicators for air quality to counties in which 141 million Americans live. Furthermore, the World Health Organization reports that 80 percent of urban residents and 98 percent living in cities in low-income countries are exposed to unsafe quality standards. The result: approximately 3 million people die each year from health ailments caused by air pollution.
The challenge now, Mazurek believes, is how do we transition from producing fine particle emissions to more sustainable sources of energy and natural gas. To emphasize this point about cleaner fuel she refers to a chilling statistic from the U.S. Department of Transportation: more than three trillion miles were traveled by vehicles in the country in 2018.
One Obama-era measure to improve air quality was recently scrapped by the Trump administration when it lowered the 52-mpg vehicle requirement for 2025. The president’s plan—to the consternation of environmentalists—reduces average mpg increases for the model years 2021-26 to 40.4 mpg by 2026.
To achieve high-fuel efficiency, Mazurek said, there needs to be a transition to 100 percent electric vehicles, hybrid gas and electric vehicles, and natural gas-powered vehicles that produce fewer emissions per mile traveled.
Temporarily, before the further opening of states brings with it the return of pollutants, we can marvel at the clear skies and imagine what the atmosphere could look like one day. To guide you, go to the European Public Health Alliance site where the European Space Agency’s satellite images illustrate how air pollution has fallen dramatically in cities across the world.